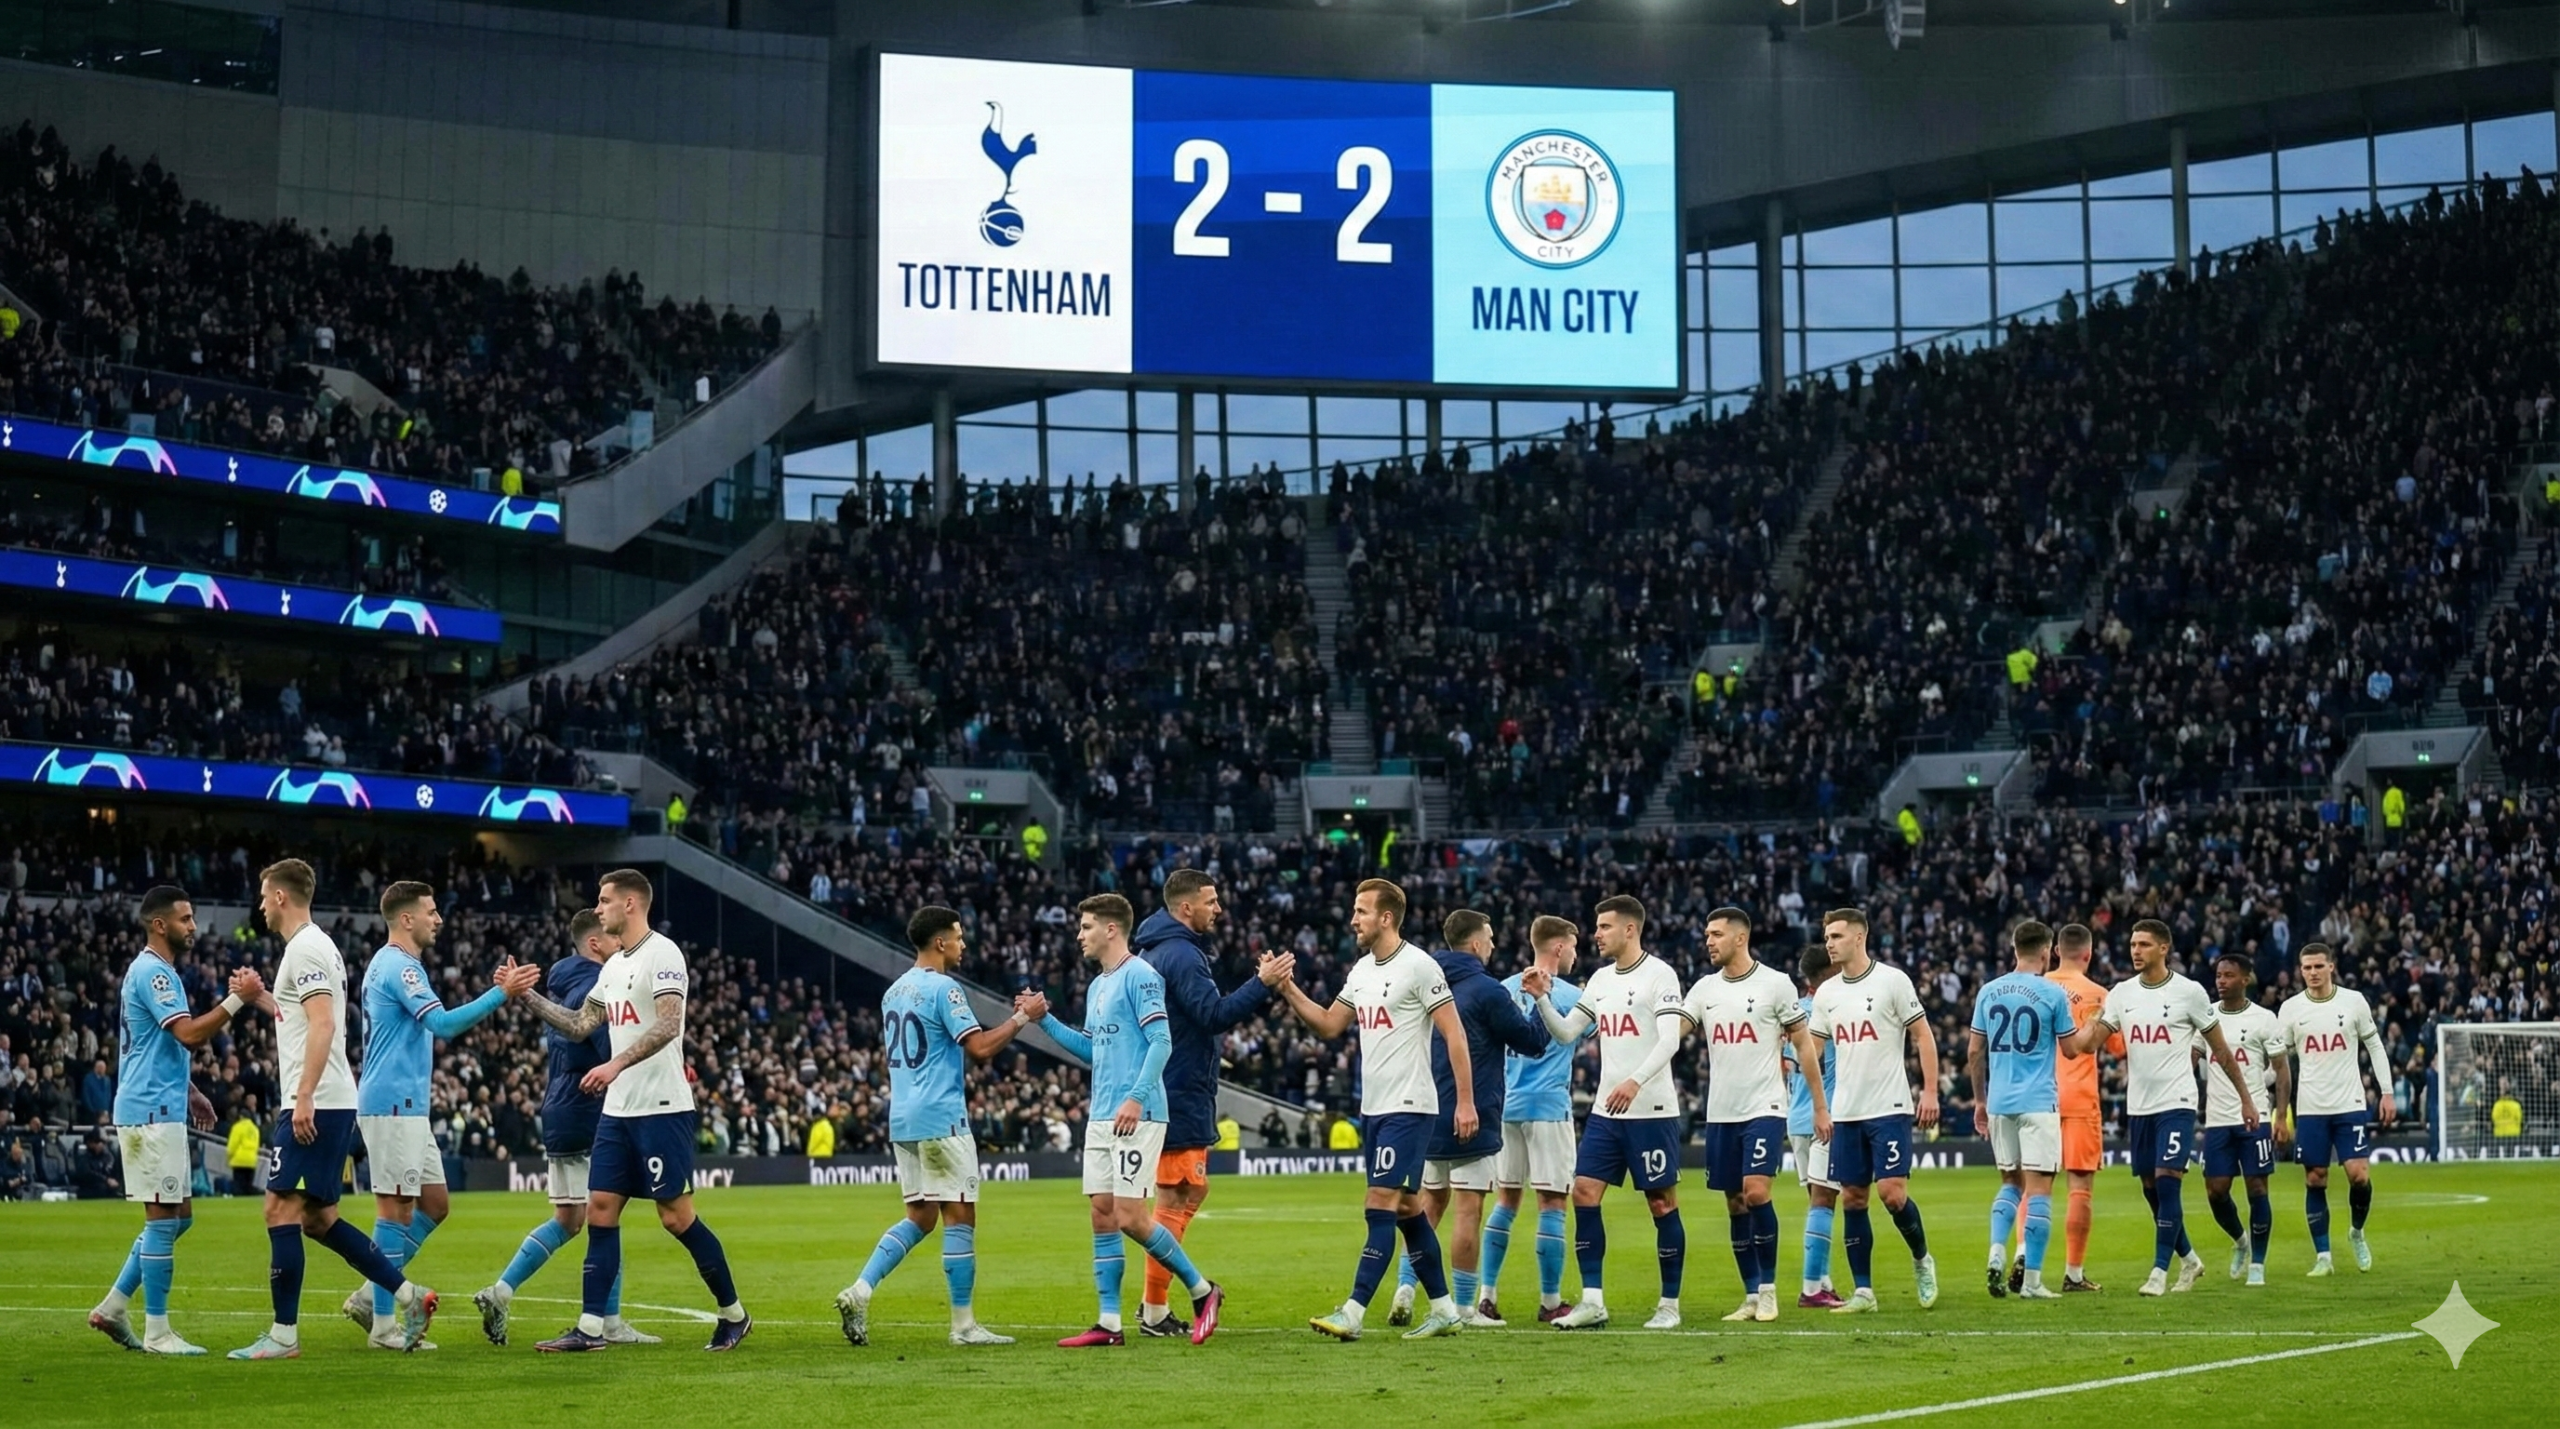
Tottenham vs Man City Stats: A Deep Dive into the 2-2 Thriller
The Premier League season of 2026 delivered yet another unforgettable moment at the Tottenham Hotspur Stadium. The recent clash between Tottenham and Manchester City ended in a dramatic 2-2 draw, leaving fans breathless. If you are looking for the most detailed breakdown of tottenham vs man city stats, you have come to the right place. This match had everything from early dominance by the visitors to a stunning second-half comeback led by Dominic Solanke.
In this article, we will analyze the key numbers that defined this game. We will look at possession, shots on target, expected goals (xG), and individual player performances. Understanding these stats helps us see how Spurs managed to fight back from a 0-2 deficit against the reigning champions. Whether you support the home side or the visitors, these numbers tell the true story of the match. Let’s dive into the data and see what really happened on the pitch.
Match Summary: The Tale of Two Halves
The game began with Manchester City showing their typical class and control. They took an early lead in the 11th minute through Rayan Cherki, who finished a smooth move assisted by Erling Haaland. City continued to press high, forcing errors from the Tottenham defense. Just before halftime, Antoine Semenyo doubled the lead for the visitors. At 0-2, it looked like another routine win for Pep Guardiola’s side, and the tottenham vs man city stats at the break heavily favored the away team.
However, the second half was a completely different story. Tottenham manager Thomas Frank made tactical adjustments that changed the flow of the game. Dominic Solanke became the hero of the day, scoring twice to level the score. His first goal gave Spurs hope, but his second was a magical “scorpion kick” that will be replayed for years. The stadium erupted as Spurs secured a valuable point, proving they can compete with the best teams in the league despite their injury struggles.
Complete Match Stats Table (2026)
To fully understand the game, we need to look at the raw numbers. The table below provides a complete comparison of the tottenham vs man city stats from this specific fixture. You can see how close the contest was in terms of chances created and defensive actions.
| Statistic | Tottenham Hotspur | Manchester City |
| Goals Scored | 2 | 2 |
| Possession | 40% | 60% |
| Total Shots | 12 | 15 |
| Shots on Target | 5 | 6 |
| Expected Goals (xG) | 1.05 | 2.08 |
| Big Chances Created | 2 | 2 |
| Passes Completed | 331 (78%) | 525 (87%) |
| Corners | 4 | 7 |
| Fouls Conceded | 12 | 7 |
| Yellow Cards | 3 | 4 |
| Saves | 4 | 3 |
Possession and Passing Analysis
When we analyze the tottenham vs man city stats regarding possession, it is clear that City controlled the ball. They enjoyed 60% possession, which is standard for a Pep Guardiola team. Their passing accuracy was also superior, completing 87% of their 525 passes. This allowed them to dictate the tempo in the first half and keep Spurs chasing shadows for long periods. Rodri was instrumental in midfield, linking play and breaking up Tottenham’s rare attacks.
Tottenham, on the other hand, had to be patient and rely on counter-attacks. With only 40% possession, they had to make every touch count. Their passing accuracy of 78% reflects the pressure they were under from City’s press. However, in the second half, Spurs used their possession much more effectively. Instead of slow build-ups, they moved the ball quickly to their forwards, bypassing the City midfield and creating chaos in the final third.
Offensive Breakdown: Shots and xG
The offensive numbers in the tottenham vs man city stats show that City was more dangerous overall, but Spurs were clinical when it mattered. Manchester City generated an Expected Goals (xG) figure of 2.08, suggesting they should have scored at least two goals. They took 15 shots in total, with 6 hitting the target. Erling Haaland was a constant threat, but he was often crowded out by the Spurs defense.
Tottenham defied the odds with an xG of only 1.05. Statistically, they should have scored only one goal, but they managed two. This highlights the brilliant finishing of Dominic Solanke. Spurs took 12 shots, with 5 on target. The fact that they converted their lower-quality chances into goals shows a high level of efficiency. This “clinical edge” is often what separates a loss from a draw in big Premier League matches.
Key Player Performance: Dominic Solanke
No analysis of the tottenham vs man city stats would be complete without highlighting Dominic Solanke. He was the undisputed Man of the Match. His two goals were the difference between a defeat and a hard-earned point. His second goal, an acrobatic heel flick over City goalkeeper Gianluigi Donnarumma, showed incredible skill and awareness. Solanke also won several aerial duels and held up the ball well for his teammates.
Beyond just the goals, Solanke’s work rate was exceptional. He pressed the City defenders tirelessly, forcing them to rush their clearances. His link-up play with teammates like Xavi Simons and Conor Gallagher improved significantly in the second half. For fantasy football managers and Spurs fans alike, Solanke’s performance was a perfect 10/10 display of leading the line against top-tier opposition.
Manchester City’s Defensive Gaps
While City’s attack was potent, the defensive tottenham vs man city stats reveal some worrying trends for the champions. Conceding two goals from an xG of just 1.05 suggests that their defense was not as tight as usual. Goalkeeper Gianluigi Donnarumma made some decent saves, but he was left exposed by his backline on both goals. The partnership of Marc Guéhi and Abdukodir Khusanov struggled to cope with Spurs’ intensity after the break.
The stats show that City conceded 12 fouls, often in dangerous areas. This allowed Tottenham to put balls into the box and apply pressure. City’s inability to keep a clean sheet in this match is part of a wider pattern this season where they have looked vulnerable to quick transitions. If they want to catch Arsenal in the title race, they will need to improve these defensive numbers in future away games.
Head-to-Head History Overview
Looking at the historical tottenham vs man city stats, this fixture rarely disappoints. Spurs have often been a “bogey team” for Manchester City, especially in London. Even with City’s dominance in English football over the last decade, they have frequently dropped points at the Tottenham Hotspur Stadium. This 2-2 draw adds another chapter to a rivalry that is always competitive and full of goals.
In the last five Premier League meetings between these two sides, both teams have scored in almost every game. The aggregate scoreline over recent seasons is incredibly close. This trend makes the fixture a favorite for neutrals and bettors alike. The history suggests that no matter form or league position, matches between Tottenham and Manchester City are always 50/50 contests.
Impact on the Premier League Table
This result had a major impact on the league standings. For Manchester City, dropping two points meant falling six points behind league leaders Arsenal. In a title race this tight, every stat and every point matters. The tottenham vs man city stats show a missed opportunity for City to close the gap. They controlled the game but failed to kill it off when they had the chance at 2-0.
For Tottenham, the point was vital for their own ambitions. It stopped a poor run of form and restored confidence in the squad. Sitting in the middle of the table, Spurs needed a positive result against a big team to ignite their season. The fighting spirit shown in the second half will give manager Thomas Frank plenty of positives to build on as they push for a European spot.
Tactical Battle: Frank vs. Guardiola
The sideline battle between Thomas Frank and Pep Guardiola was just as fascinating as the action on the pitch. Guardiola’s setup, focused on possession and width, dominated the first 45 minutes. The tottenham vs man city stats clearly reflect his game plan working early on. City overloaded the midfield and isolated Spurs’ defenders.
However, Thomas Frank’s halftime team talk worked wonders. He instructed his team to press higher and take more risks. By bringing on substitutes like Pape Matar Sarr, he injected energy into the midfield. This disrupted City’s rhythm and forced turnovers. The match ended as a tactical stalemate, with Frank proving he can adapt and outsmart even the best managers in the world when his team’s back is against the wall.
Future Outlook for Both Teams
What do these tottenham vs man city stats tell us about the rest of the season? For City, the stats suggest they are still an attacking powerhouse but need to tighten up at the back. Players like Erling Haaland and Bernardo Silva are creating enough chances, but the defense needs to stop leaking soft goals. They have the quality to go on a winning run, but they cannot afford many more slip-ups.
For Tottenham, the stats are a sign of potential. If they can replicate the intensity of the second half against other teams, they will climb the table quickly. Getting key players back from injury will also help improve their possession numbers. This draw feels like a win for Spurs and could be the turning point in their 2026 campaign.
Frequently Asked Questions (FAQs)
1. Who scored the goals in the Tottenham vs Man City 2-2 draw?
For Manchester City, Rayan Cherki scored in the 11th minute and Antoine Semenyo scored in the 44th minute. For Tottenham, Dominic Solanke scored both goals in the 53rd and 70th minutes.
2. What was the possession stat for Tottenham vs Man City?
Manchester City dominated possession with 60% of the ball, while Tottenham had 40%. Despite having less of the ball, Spurs were able to create effective chances in the second half.
3. Who was the Man of the Match?
Dominic Solanke was widely considered the Man of the Match. He scored two crucial goals to bring Tottenham back from 0-2 down, including a spectacular scorpion kick.
4. How many shots on target did each team have?
According to the official tottenham vs man city stats, Manchester City had 6 shots on target, while Tottenham had 5. It was a very even contest in terms of accurate shooting.
5. Who is the goalkeeper for Manchester City in 2026?
In this match, the goalkeeper for Manchester City was Gianluigi Donnarumma. He made several saves but was unable to stop Solanke’s two strikes.
6. Did Erling Haaland score in this match?
No, Erling Haaland did not score. However, he did provide the assist for Rayan Cherki’s opening goal. He had a few chances but was kept quiet by the Spurs defense.
Conclusion
The 2-2 draw between Tottenham and Manchester City was a classic Premier League encounter. The tottenham vs man city stats reveal a game of two halves, where tactical changes and individual brilliance determined the outcome. From City’s early dominance to Solanke’s incredible comeback, this match had it all.
Analyzing these stats gives us a deeper appreciation of the game. It shows that possession isn’t everything and that fighting spirit can change the numbers that matter most: the scoreline. As the season continues, both teams will look back on this match as a pivotal moment. We hope this detailed breakdown has helped you understand exactly what happened on that thrilling Sunday afternoon.