

Bundesliga Statistiken
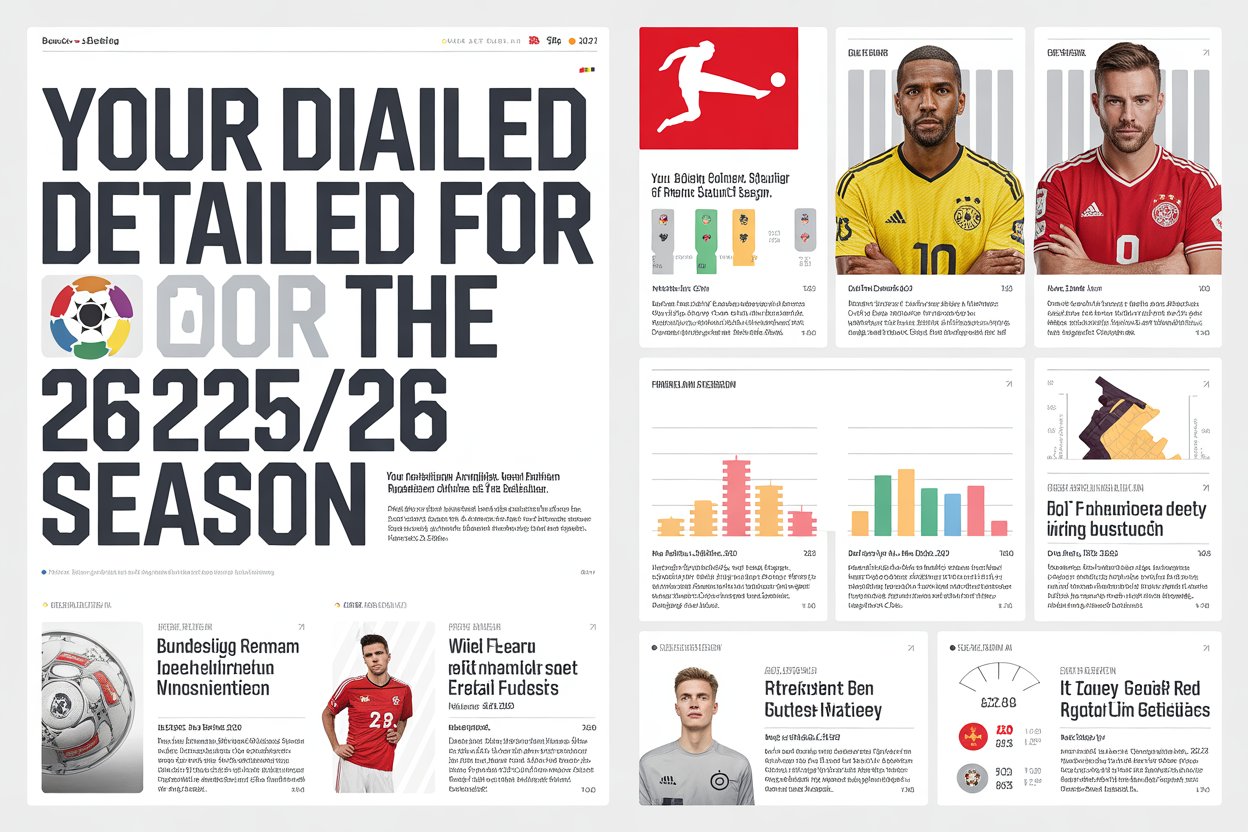
Bundesliga-Statistiken: The Pulse of German Football (1963 → Today)
Not just numbers. Every sprint, tackle, and spectacular goal—captured, compared, and understood.
xG, xGA, top speed, progressive carries—modern insights beyond the scoreboard.
Spot “goal-fests,” defensive battles, and hidden performance spikes week by week.
Compare stars like Harry Kane with legends like Gerd Müller—fairly and clearly.
What Are Bundesliga-Statistiken?
When we talk about bundesliga statistiken, we are looking at the pulse of German football. These are not just boring digits on a screen. They represent every sprint, every tackle, and every spectacular goal scored since the league began in 1963. Statistics help us compare players across different eras. For example, how does a modern star like Harry Kane compare to the legendary Gerd Müller? By looking at goals-per-game ratios and assist numbers, we can see the evolution of the game. Today, data is more advanced than ever. We now track “Expected Goals” (xG) and “Top Speed” to see who is truly performing at an elite level.
Detailed Bundesliga Historical Table
| Category | Record Holder | Statistic Value |
|---|---|---|
| Most Titles | FC Bayern Munich | 33 Titles |
| All-Time Top Scorer | Gerd Müller | 365 Goals |
| Most Appearances | Karl-Heinz Körbel | 602 Matches |
| Most Clean Sheets | Manuel Neuer | 224+ Clean Sheets |
| Youngest Goalscorer | Youssoufa Moukoko | 16 Years, 28 Days |
| Highest Attendance | Berlin Olympiastadion | 88,075 Fans |
Why Fans Love Analyzing the Numbers
Have you ever wondered why some teams always seem to win at home? Or why certain strikers only score in the second half? Fans use bundesliga-statistiken to answer these questions. It adds a layer of strategy to watching the match. It’s like being a detective where the clues are hidden in the box score.
In the 2024-2025 season, the data shows that the Bundesliga remains the highest-scoring top-tier league in Europe. With an average of over 3 goals per match, it is a paradise for fans who love attacking football. By keeping an eye on these trends, you can predict which matches will be “goal-fests” and which will be defensive battles.
Home teams win about 45% of Bundesliga matches on average.
Recent seasons often land around (or above) 3 goals per match—pure entertainment.
1983-84 holds the record: 1,097 goals total (3.58 per game).
Team Performance: Who Dominates the Pitch?
When looking at team-based bundesliga-statistiken, Bayern Munich usually leads the pack. They have a history of high possession and incredible shot accuracy. However, teams like Bayer Leverkusen and Borussia Dortmund are constantly closing the gap with high-intensity pressing and fast counter-attacks.
The current season has shown a shift in how teams defend. Clean sheets are becoming harder to earn because teams are playing more bravely. Analyzing “Expected Goals Against” (xGA) helps us see which defenses are lucky and which are actually solid. A team might concede few goals, but if their xGA is high, it means their goalkeeper is doing a lot of heavy lifting!
What to track every weekend
- Possession + shot accuracy (control vs. threat)
- Press intensity (how quickly a team wins the ball back)
- xGA (is the defense truly strong or just surviving?)
- Clean sheets (harder now because teams attack more)
Quick strategy takeaway
If a team has low goals conceded but a high xGA, it often means the keeper is saving them. That can be great short-term, but risky if the pressure keeps coming. It also helps you spot which matchups might flip suddenly.
Individual Player Records to Watch
Individual bundesliga-statistiken are where the stars truly shine. We look at more than just goals. We look at “Progressive Carries,” which tells us which players are best at moving the ball forward. We also look at “Chances Created” to find the unsung heroes in the midfield who set up the big moments.
Harry Kane has recently been the name on everyone’s lips. His clinical finishing is backed up by stats that show he rarely misses a “Big Chance.” Meanwhile, young talents like Florian Wirtz are breaking records for assists and successful dribbles. Watching these numbers climb each week is one of the best parts of being a Bundesliga follower.
Fan tip
When a player’s xG stays high but goals stay low, it usually screams “finishing slump.” The chances are there. The goals often follow soon.
The Rise of Advanced Metrics: xG and Beyond
In the past, we only cared about the final score. Now, bundesliga-statistiken include advanced metrics like Expected Goals (xG). This math formula calculates the probability of a shot becoming a goal based on distance, angle, and defender pressure.
xG = Probability of a Goal (0 to 1)If a player has 5 goals but an xG of only 2, they are “overperforming” or finishing difficult shots. If their xG is 10 but they only have 2 goals, they are struggling with their finishing. These insights help scouts find hidden gems and help fans understand if a team’s winning streak is likely to continue.
Home Advantage: Myth or Reality?
Does playing at home really matter? The bundesliga-statistiken say yes! German fans are famous for their “Yellow Walls” and passionate singing. This atmosphere often leads to a higher win percentage for the home side. On average, home teams in the Bundesliga win about 45% of their matches.
Away teams have to deal with travel fatigue and a hostile crowd. When we look at the data, away teams tend to commit more fouls and receive more yellow cards. Understanding this “Home vs. Away” dynamic is crucial for anyone trying to predict the outcome of a weekend fixture.
Goal Scoring Trends Over the Decades
The Bundesliga has always been a “Goals Galore” league. If you look at historical bundesliga-statistiken, the 1983-84 season holds the record with 1,097 goals. That is an insane average of 3.58 goals per game! Even today, the league stays true to its roots.
Modern tactics have changed how goals are scored. We see fewer long-range “screamers” and more goals from high-quality chances inside the box. This is because coaches now use data to tell players where they have the best chance of scoring. It is a perfect blend of human talent and mathematical precision.
Defensive Masterclasses and Goalkeepers
We cannot talk about bundesliga-statistiken without mentioning the men between the posts. Manuel Neuer changed the game by becoming a “sweeper-keeper.” His stats for “touches outside the box” are often higher than some midfielders!
Goalkeepers are now judged on their “Save Percentage” and “Goals Prevented.” A high number of saves is good, but preventing a goal that “should” have gone in is even better. This season, keepers like Gregor Kobel and Peter Gulacsi have shown that a strong defense starts with a reliable pair of hands.
Discipline: Yellow and Red Card Data
Football is a physical game, and the bundesliga-statistiken for fouls and cards prove it. Some teams play a “hard but fair” style, while others struggle with discipline. Tracking which players are one yellow card away from a suspension is vital for team planning.
Interestingly, the number of red cards has decreased over the years. This is likely due to the introduction of VAR and better player education. However, “Tactical Fouls” are still a major part of the game. These are small fouls used to stop a dangerous counter-attack before it starts.
How to Use Stats for Fantasy Football
If you play Bundesliga Fantasy, you live and breathe bundesliga-statistiken. You don’t just want a player who scores; you want a player who wins duels, makes key passes, and gets clean sheets.
Look for high xG
These players will eventually score.
Check for “Pass Accuracy”
Midfielders with high accuracy get more points for ball retention.
Watch for “Ball Recoveries”
Defensive midfielders are the engines of fantasy teams.
By using these data points, you can build a squad that wins even when your captain doesn’t find the back of the net.
The Future of Football Data
As technology improves, bundesliga-statistiken will become even more detailed. We are already seeing chips in the ball and wearable sensors on players. This gives us “Heat Maps” that show exactly where a player spent their time on the field.
In the future, we might see real-time probability shifts during the game. Imagine a screen telling you there is an 80% chance of a goal right before a free kick is taken! The Bundesliga is at the forefront of this digital revolution, making the beautiful game more transparent for everyone.
Conclusion: Numbers Make the Game Better
At the end of the day, bundesliga-statistiken are about more than just winning or losing. they help us appreciate the skill and effort that goes into every match. Whether it’s a record-breaking goal or a goal-line clearance, the data captures the magic of the moment forever.
So, the next time you watch a game, take a look at the live stats. You might find a whole new reason to love the Bundesliga. The numbers don’t lie—German football is simply world-class.
Frequently Asked Questions
1. Who has the most goals in Bundesliga history?
The legendary Gerd Müller holds the record with 365 goals. Robert Lewandowski came close with 312, but “Der Bomber” remains the king of the scorers.
2. What team has won the most titles?
FC Bayern Munich is the most successful club by far, having won 33 titles. Their dominance is a major part of the league’s history.
3. What does “Expected Goals” (xG) mean?
xG is a statistic that measures the quality of a goal-scoring chance. It tells you how likely a shot is to go in based on historical data from similar situations.
4. Which player has the most assists in a single season?
Thomas Müller holds the record for the most assists in a single season with 21. He is known as the “Raumdeuter” or interpreter of space.
5. Why is attendance so high in the Bundesliga?
The Bundesliga has some of the lowest ticket prices among top European leagues and a massive fan culture. This leads to the highest average attendance in the world.
6. Where can I find live bundesliga-statistiken?
You can find real-time data on the official Bundesliga website, as well as apps like FotMob, SofaScore, and various sports news portals.
You also like to read
About : Newfoundland Dog Breed Guide